Patterns from the Past: Using Visuals to Showcase Correlation and Analysis
Kelley Conner Lear, CG®
Content
About this webinar
Visual enhancements can transform dense genealogical information into clear, accessible evidence. This session demonstrates how thoughtfully designed tables, diagrams, timelines, and maps can distill complex evidence and clarify analysis. Drawing on real-world examples from research reports, kinship determinations, and case studies, we’ll explore how visuals can emphasize evidence, reveal patterns, and show relationships that words alone might obscure. You’ll learn how to pair the right type of visual to your specific goal—whether demonstrating patterns, evaluating source reliability, or placing an ancestor in the right place at the right time. Attendees will leave with practical strategies for letting visuals do some of the analytical heavy-lifting in their next project.
About the speaker
Key points and insights
Effective genealogical research is more than a simple collection of names and dates; it is a discipline built upon rigorous analysis and clear communication. In the webinar "Patterns from the Past: Using Visuals to Showcase Correlation and Analysis," Kelley Conner Lear, CG, illustrates how visual tools are indispensable for the modern researcher. Far from being mere illustrations, charts, maps, and tables serve as the heavy machinery of correlation, allowing genealogists to expose hidden patterns, weigh conflicting evidence, and make complex reasoning visible to any reader. By aligning research with the Board for Certification of Genealogists (BCG) standards—specifically Standard 65—practitioners can transform a "groaning weight of words" into precise visual arguments that withstand professional scrutiny.
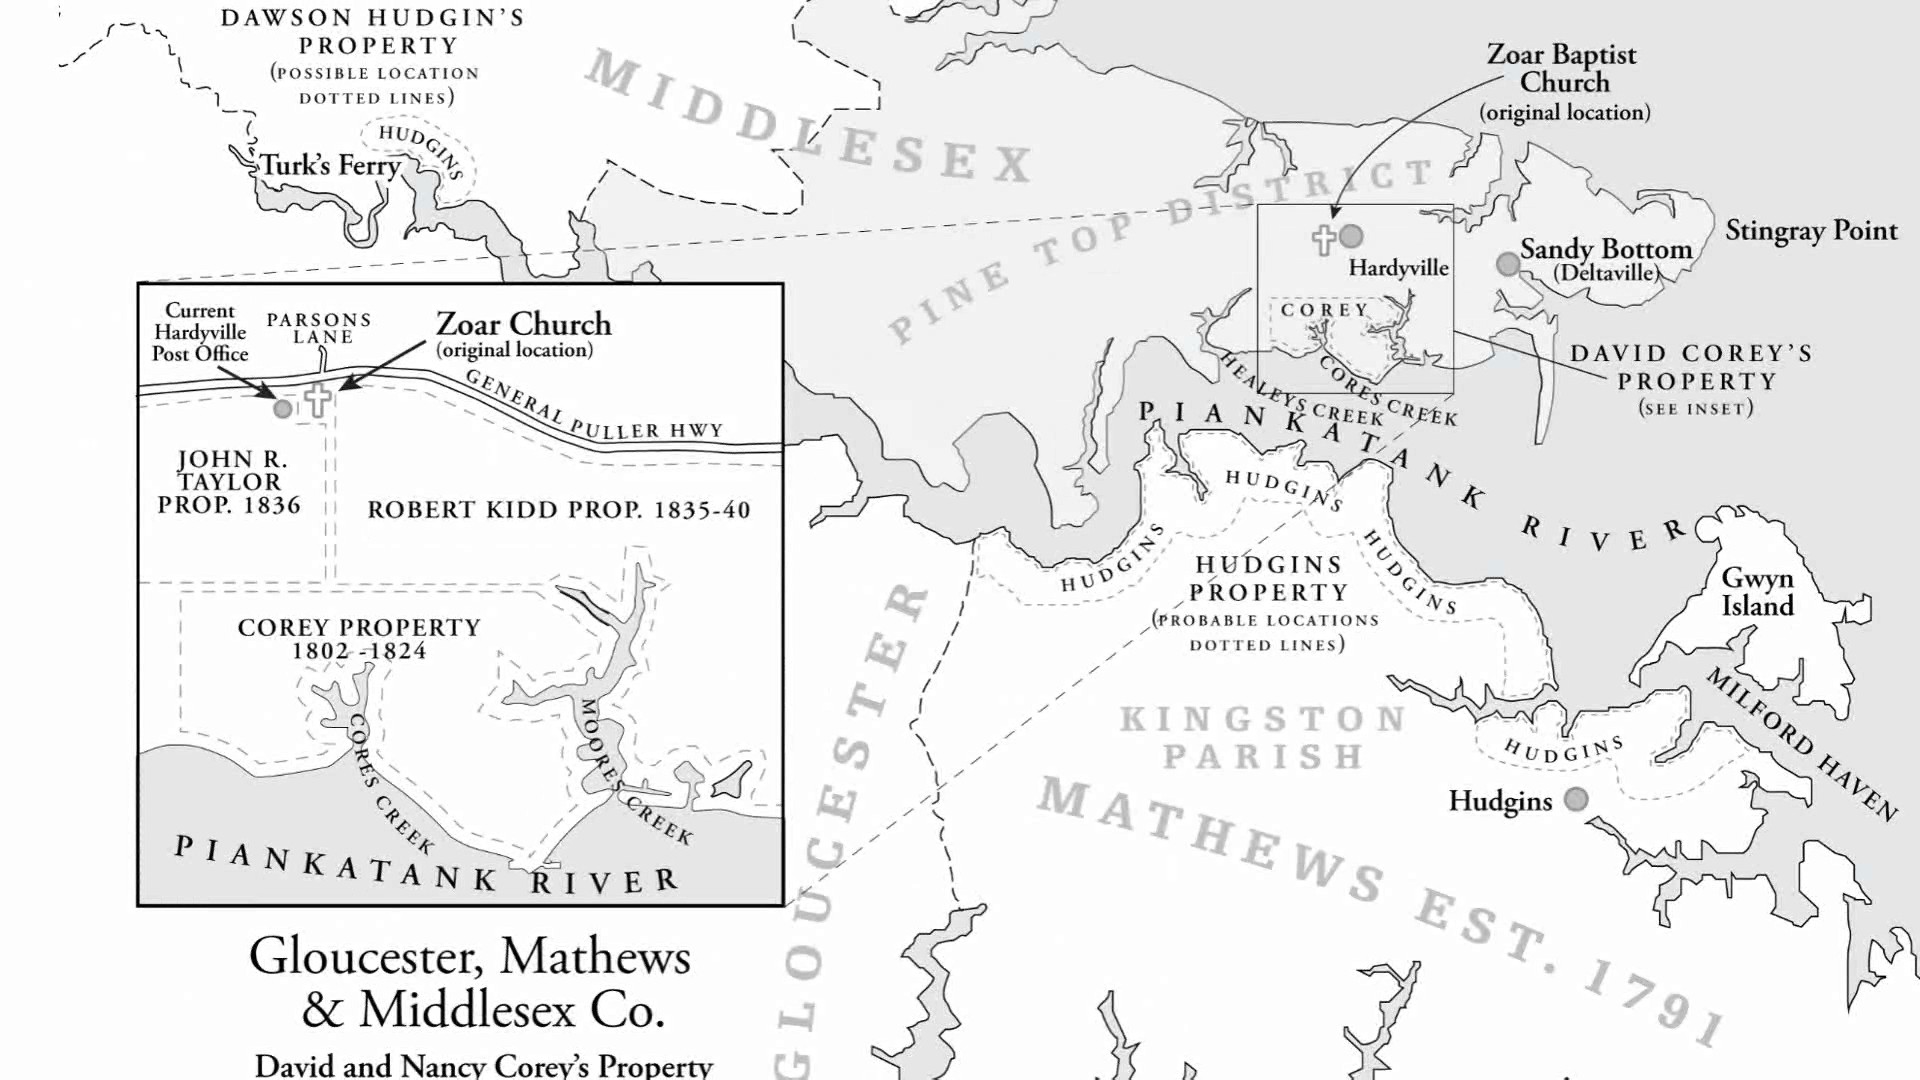
- Visuals as Analytical Engines: Visual tools should be treated as active instruments of analysis rather than passive decorations. Whether employing a side-by-side comparison table to resolve conflicting birth dates or utilizing a layered map to demonstrate migration plausibility, the choice of tool must be driven by the specific analytical problem at hand. Standard 65 emphasizes that assembled research should "show" information reliability, meaning a well-constructed figure can communicate a complex geographic or chronological argument much more effectively than a lengthy narrative.
- Strategic Layout and Order: The arrangement of data within a visual tool is a critical decision that fundamentally guides a reader’s comprehension. For example, in a timeline, the specific order of columns—such as placing the year before the name—can highlight chronological patterns that might otherwise be lost if names were listed first. Following community-wide standards, such as the Chicago Manual of Style for formatting and Standard 71 for cross-referencing visuals within the text, ensures that the evidence "earns its keep" and remains accessible to the audience.
- Systemic Pattern Recognition: Broadening research scope often reveals systemic errors or trends that a narrow focus on a single ancestor would miss. The webinar details a fascinating case study where "duplicate" ancestors in a census were resolved by identifying a county-wide pattern of enumerator error. By visualizing a sample of young adults who appeared twice in the same census year, the researcher proved a consistent pattern of "padding" by the assistant marshal, effectively resolving an identity conflict through the visualization of county-wide data trends.
To truly elevate your genealogy from simple record-gathering to high-level professional analysis, viewing the full webinar is an essential next step. It provides a masterful look at the "how" and "why" behind data visualization, complete with deep dives into evidence mining and signature analysis. Genealogists are also encouraged to explore the additional resources in the syllabus, which contains a valuable matrix for matching analytical goals to visual tools and a list of accessible design software to help you bring the patterns of your own family's past into clear focus.
Related webinars


Comments (69)
Excellent webinar - great material, extremely well presented andi love the limerick!
This was such a helpful webinar! Thank you!
Excellent, informative, and instructive presentation on using visuals. Kelley showed how visuals can assist genealogists in presenting findings. She also demonstrated how they can be used to analyze conflicts before determining a conclusion.
Excellent webinar by Kelley Conner Lear showing how to different types of tables, maps, and trees can clearly show how a variety of sources support a specific conclusion. EXCELLENT webinar! Well worth watching! It inspires me to look up and read articles Kelly has written to see more details about her methods in action.
You make it very clear to follow. I have been doing genealogy for a very long time and I follow the same patterns but I will re think my tables yours look to be more understandable.
Excellent content well laid out.
Kelly gave an excellent presentation, and I highly recommend it to anyone trying to resolve brickwalls, especially when you have conflicting information.
Excellent webinar! Thanks for all of the great ideas to help correlate and analyze data.