Visualizing Information for Genealogists

Margaret R. Fortier, CG
Jan 15, 2019
4.7K views
CC
Want to watch the full webinar?
Join now to access all 2,186 webinars and unlock all features.

Content

Play. Playing.
Welcome
1m 01s
Play. Playing.
Learn about BCG
2m 38s
Play. Playing.
Speaker's Introduction
1m 00s
Play. Playing.
Introduction
2m 03s
Play. Playing.
How We Visualize Information
20m 25s
Play. Playing.
How it Applies to Genealogists
9m 05s
Play. Playing.
Examples
11m 29s
Play. Playing.
Announcements
53s
Play. Playing.
Questions / answers
8m 46s

About this webinar

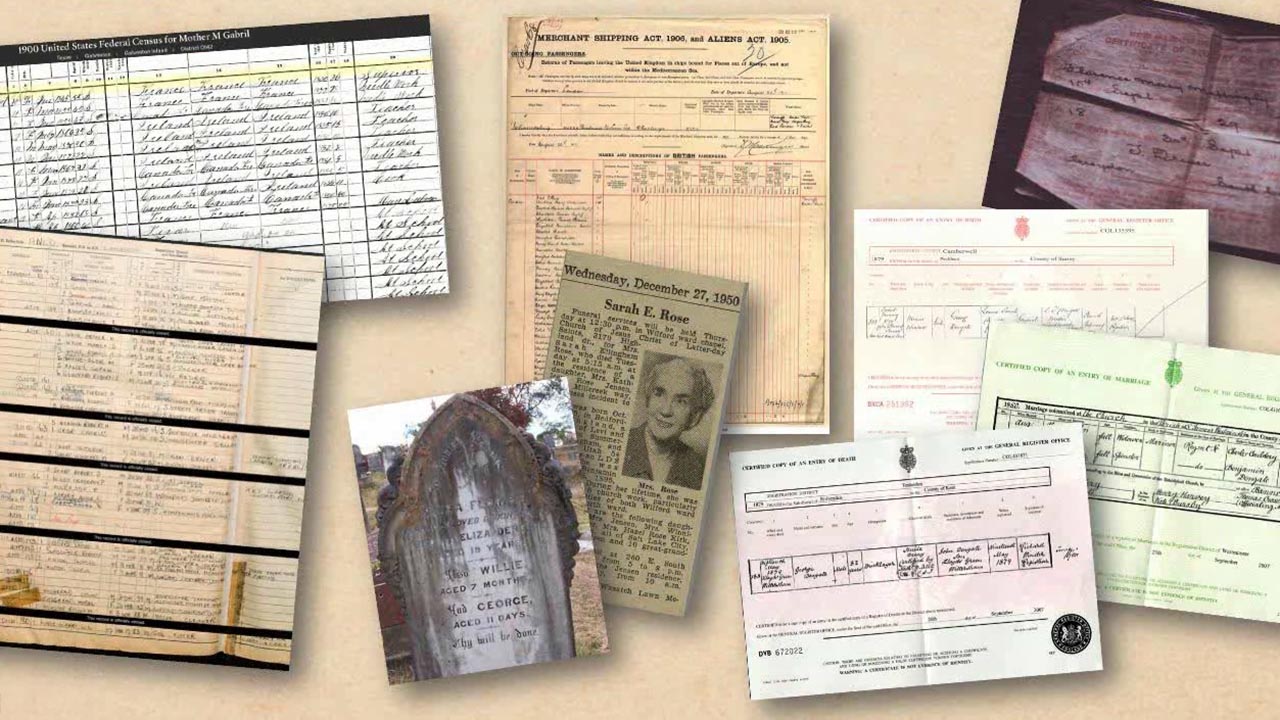
You have toiled over your client report. You have delved into the data, mined it for every iota of information, you have examined and evaluated your sources, analyzed and correlated your evidence, resolved any conflicts, and carefully crafted a narrative. Your report is accurate, but does your presentation compellingly tell the story? Does your work convincingly summarize the depth and breadth of your analysis? Are you using all the tools available to you to effectively communicate with your clients and engagingly present the story of their ancestors? This presentation will show how to use text and images effectively in client research and why it matters. Several examples will illustrate how to go from raw data to a polished, professional display of information.

About the speaker

About the speaker

Named for her grandmothers and inspired by her mother’s phenomenal memory, Margaret R. Fortier, CG, is a genealogical researcher, lecturer, and writer. Her research focuses on French-Canadian, Italian, and Portuguese immigrants. She is co-editor o
Learn more...

Comments

Your email address will not be published. Required fields are marked *

1000 characters remaining

Sort by Newest
Sort by Close.
  • Newest
  • Oldest
  • Likes

Related Webinars